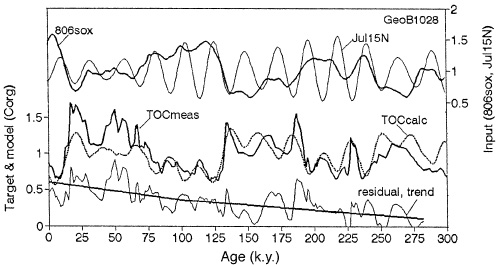
Figure 22. Statistical modeling of TOC content in Core GeoB1028 on the Walvis Ridge (near DSDP Site 523). Input is global sea level, as reflected in a global oxygen-isotope signal (806sox) and seasonal insolation, as reflected in solar energy received during July at 15°N. After accounting for the trend (caused by decay), r2 is 0.65. Data sources: TOC, Geowissenschaften Bremen; 806sox, Berger et al. (1995); and Jul 15N, Berger and Loutre (1991).