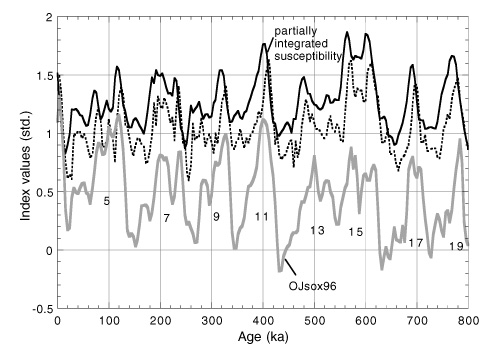
Figure 23. Correlation of magnetic susceptibility ("partially integrated susceptibility") and a global oxygen-isotope curve ("Ojsox96"). Dashed line = magnetic susceptibility. OJsox96, Ontong Java G. sacculifer oxygen-isotope curve, as given in Berger et al. (1996).