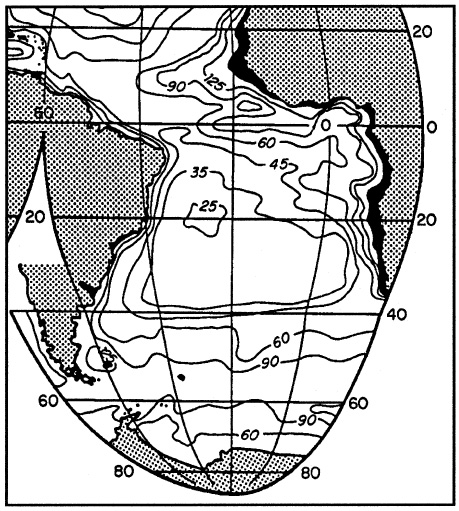
Figure 3. Productivity map of the South Atlantic ("Dahlem" map), based on a compilation of available information up to 1987, including satellite observations on ocean color. Numbers are productivity in grams of carbon per square meter per year (gC/m2/y). From Berger et al. (1989, p. 453).