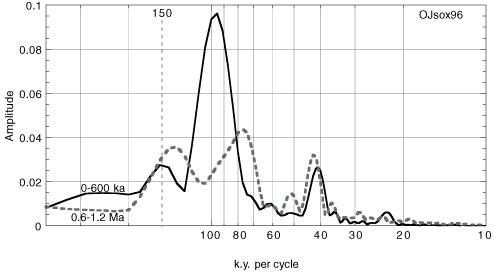
Figure 6. Spectrum of oxygen-isotope record from Ontong Java Plateau (OJsox96; Berger et al., 1994, 1996). Amplitude represents the Fourier components of the autocorrelation series. Note the absence of 100-k.y. power before the Milankovitch Chron (last 625 k.y.).