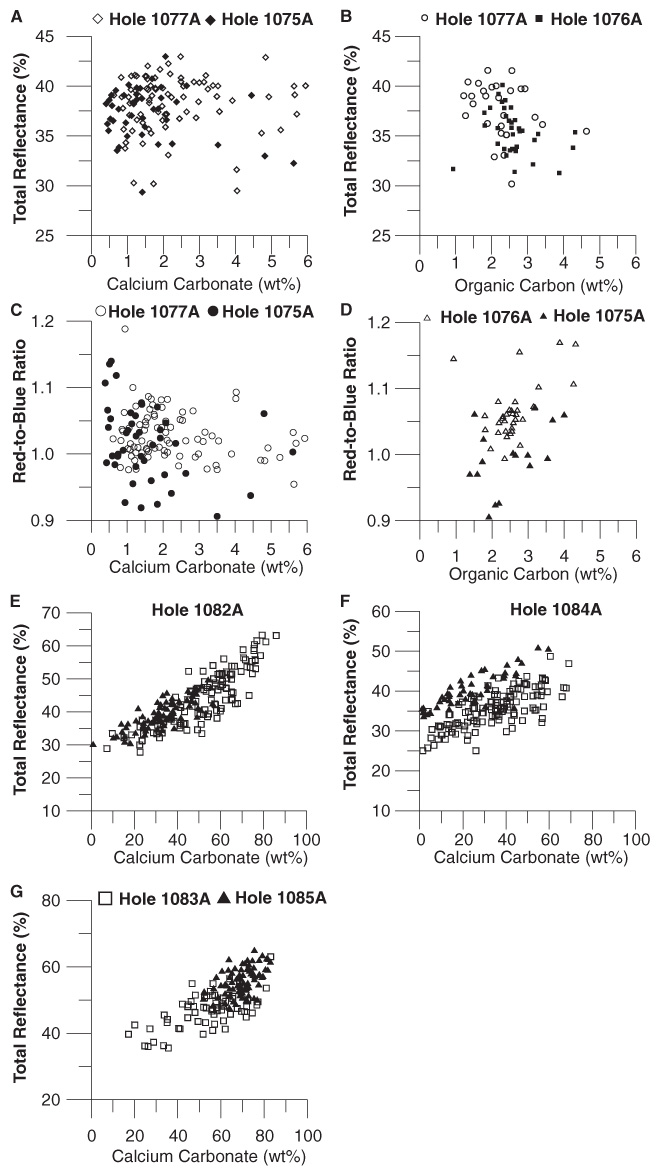
Figure 3. Relationship between color measurements (total reflectance and red/blue ratio) and calcium carbonate and organic carbon contents for (A–D) Holes 1075A, 1077A, and 1076A, respectively; (E–F) Holes 1082A and 1084A, respectively (solid triangles = measurements for levels with high amount of diatoms, defined as diatomaceous clay; open squares = nannofossil clay and nannofossil ooze); and (G) Holes 1083A and 1085A.


![]()