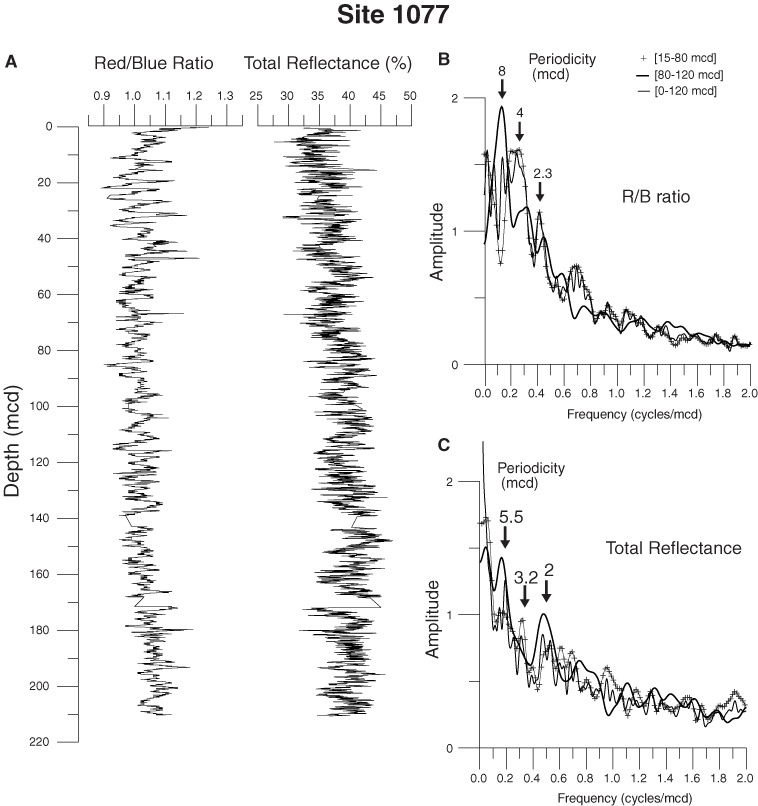
Figure 4. Stratigraphic variations in (A) the total reflectance and the red/blue ratio at Site 1077. Spectral analysis of (B) the r/b ratio and (C) total reflectance (color data) for three depth intervals. The spectra are computed using the Blackman-Tukey method with a Barlett-type window. The variance power has been normalized to 100% on the frequency range of 0 to 3. The square root of the amplitude is shown. Frequency is given as cycles per meter composite depth.


![]()