![]() Figures F1-F5
Figures F1-F5
![]() Table
T1
Table
T1
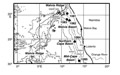
F1. Locations of Sites 1081-1085.
F2. Comparison of Site 1082 opal data from two laboratories.
F3. Amount of opal extracted with time for selected OLin and OPer samples.
F4. Relationships between OLin and OPer opal values.
F5. Opal records at Sites 1082 and 1084.
T1. Mean opal concentrations and distance to the mean of OLin and OPer samples.