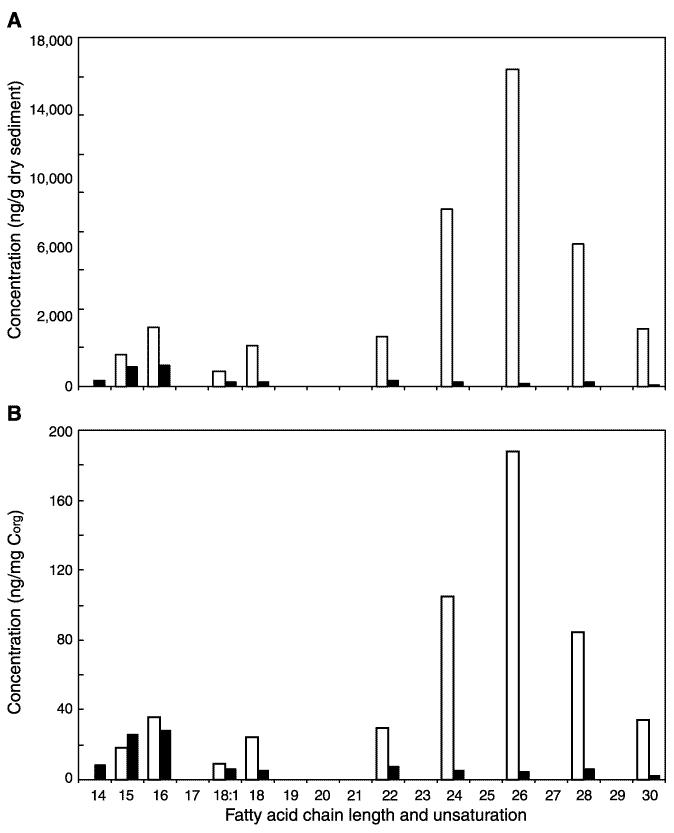
Figure F6. Profiles of fatty acids in surface (open) and deep (solid) samples expressed as (A) absolute concentration per gram dry sediment and (B) relative abundance to Corg.