![]() Figures F1-F7
Figures F1-F7
![]() Table T1
Table T1
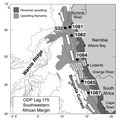
F1. Locations of the six drill sites on the southwest Africa margin.
F2. Concentrations of calcium carbonate.
F3. Concentrations of organic carbon.
F4. Comparison of concentrations of organic carbon and calcium carbonate.
![]()
F5. Comparison of C/N ratios to organic carbon.
![]()
F6. Rock-Eval pyrolysis diagrams for organic matter.
![]()
F7. Relation of Rock-Eval pyrolysis hydrogen indices and organic carbon concentrations.
![]()
T1. Core sites and depositional parameters.