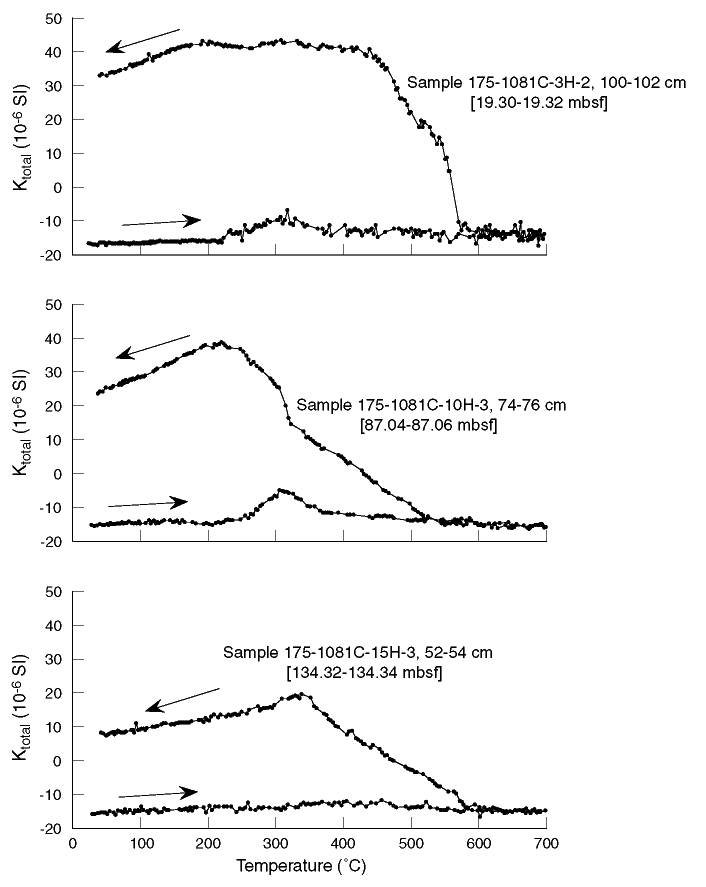
Figure F5. Temperature dependence of susceptibility (K) for discrete samples from Hole 1081C. The heating curve is indicated by the right-pointing arrow; the cooling curve, by the left-pointing arrow. Volume susceptibilities data are corrected for average furnace value.

![]()