![]() Figures F1-F8
Figures F1-F8
![]() Table
T1
Table
T1
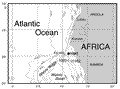
F1. Site map showing the location of Site 1081.
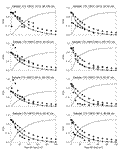
F2. Normalized intensities during ARM acquisition and ARM, NRM, and SIRM demagnetization.
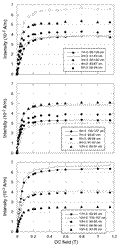
F3. Intensity vs. applied DC field during progressive IRM acquisition.
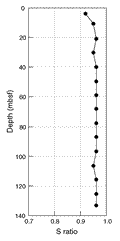
F4. S ratios.
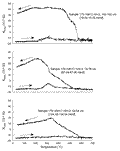
F5. Temperature dependence of susceptibility (K).
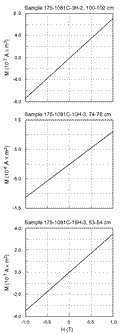
F6. Hysteresis loops.
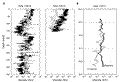
F7. Intensity vs. depth.
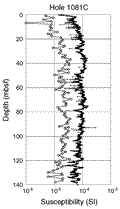
F8. Volume susceptibility vs. depth.
T1. Summary of rock magnetic data.