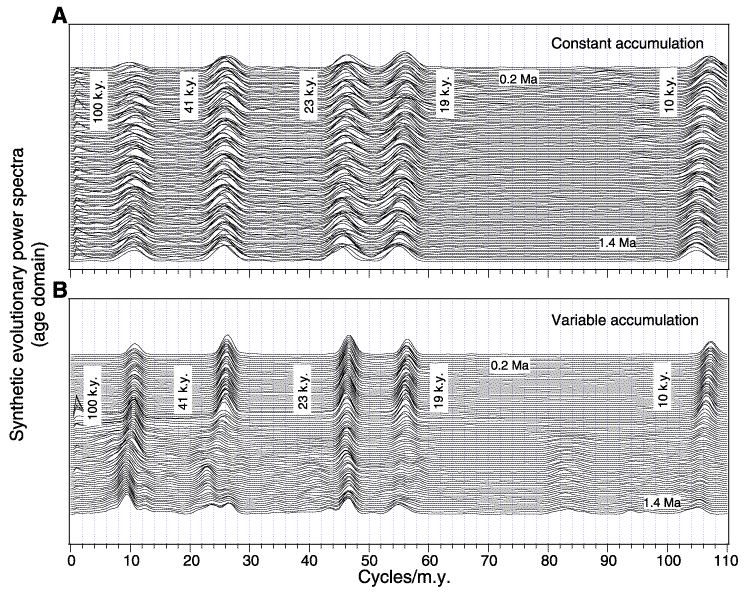
Figure F12. A. Evolutionary spectra obtained from synthetic density profiles reproduce input frequencies well over time (measured in cycles per million years) for constant accumulation rates (ARs). A slight decrease in frequency is noted for the 10-k.y. cycle, probably because of the aliasing effects. B. In contrast, spectra exhibit noticeable deviations from this pattern when ARs change rapidly.

![]()