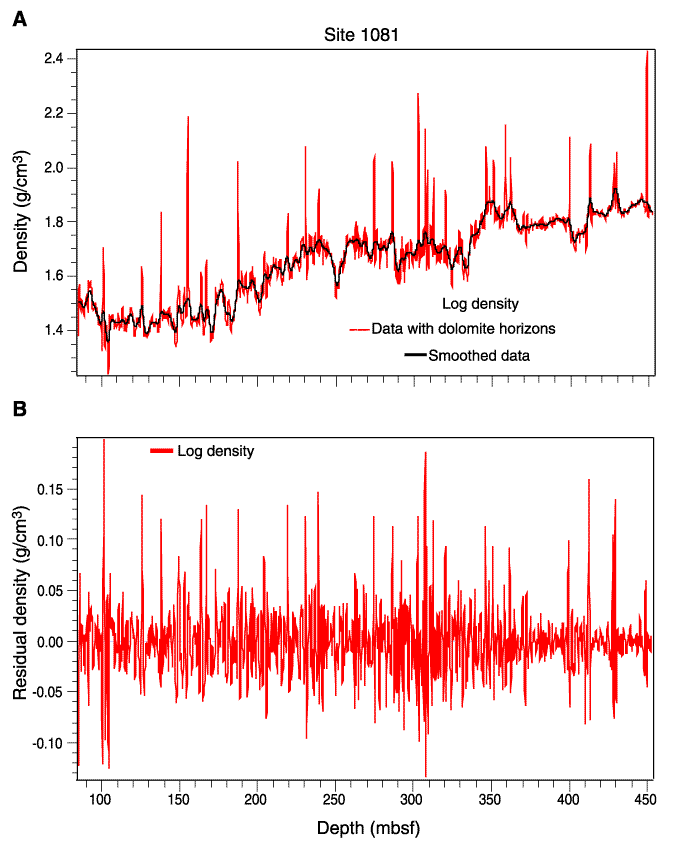
Figure F3. Log density data at Hole 1081A. (A) Original data contain strong density contrasts due to the presence of dolomite horizons (stippled line). Data in (A) are interpolated (solid gray line) and smoothed (black line). Subtraction of the smoothed data profile from the interpolated data yields (B) an interpolated residual density profile on which spectral analyses were performed.

![]()