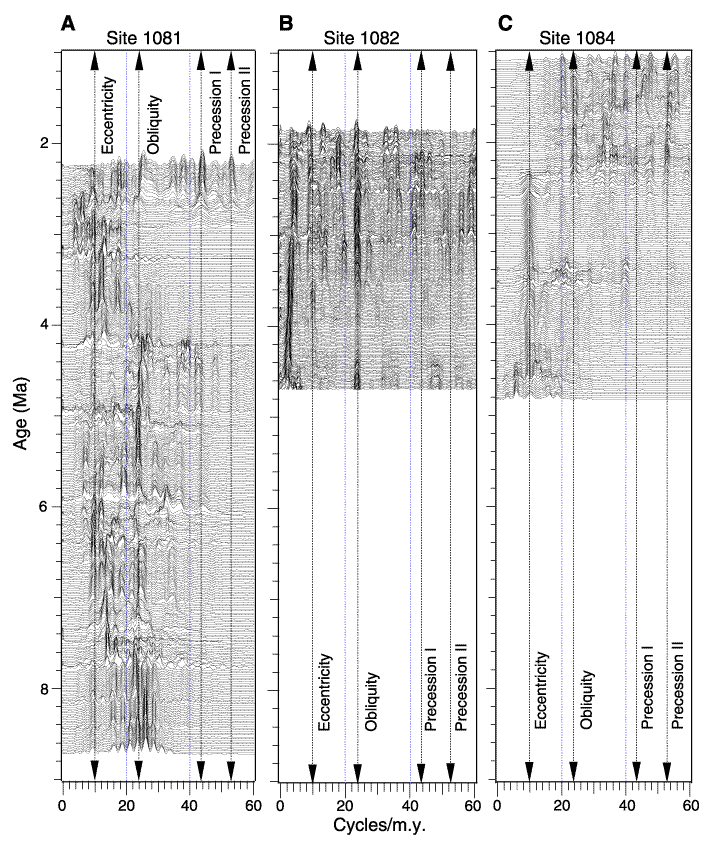
Figure F8. Spectral energy detected in log density profiles over time show cyclic patterns that match the three Milankovitch cycles at (A) Site 1081 between 6.0 and 4.3 Ma. Similar rhythmic patterns were observed between 3.0 and 2.2 Ma at the same site and at (B) Site 1082. At (C) Site 1084, spectral power is mainly characterized by obliquity and precession between 1.0 and 2.4 Ma, whereas eccentricity dominates thereafter. Periodicity before 6.0 Ma was only available from records at Site 1081 and shows a complex wax-and-wane pattern between eccentricity and obliquity, but no indication of precession. Intermittent frequencies are explained with noise effects induced by very strong density variations.

![]()