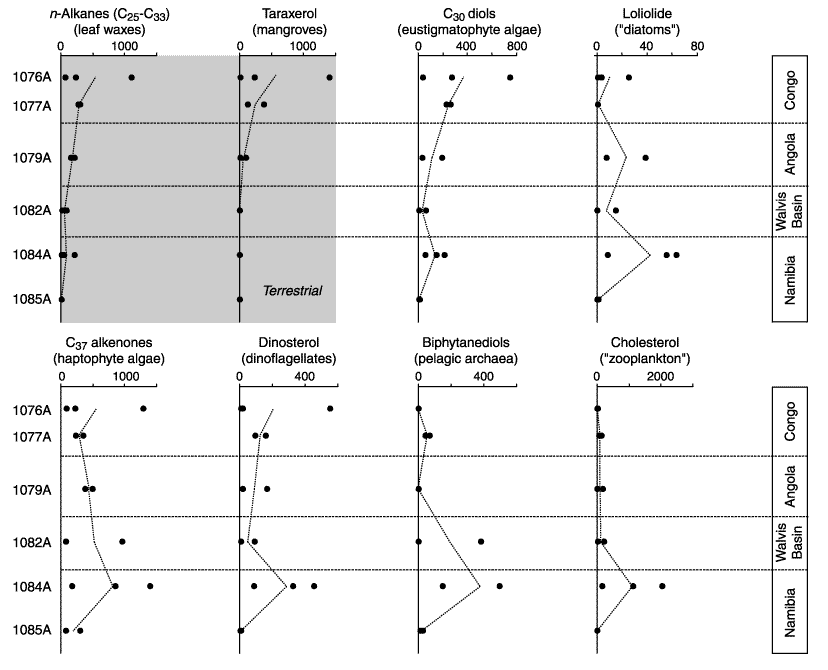
Figure F8. Concentrations of quantified biomarker lipids (in micrograms per gram of TOC). Averages of concentrations of each site are connected by a stippled line.