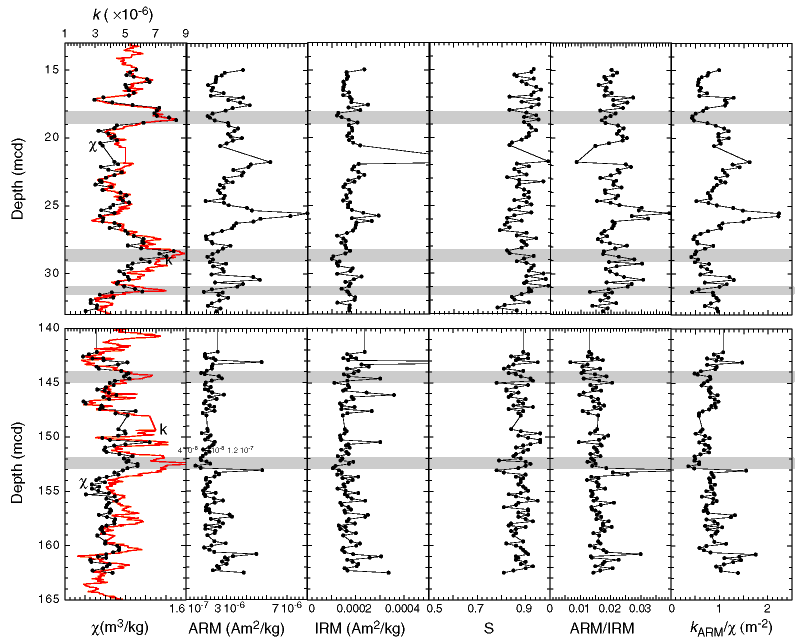
Figure F6. Rock-magnetic properties of the two investigated depth intervals (top panel = upper interval; bottom panel = lower interval). Horizontal shaded boxes highlight high values of shipboard susceptibility values (far left panel) for comparison.

![]()