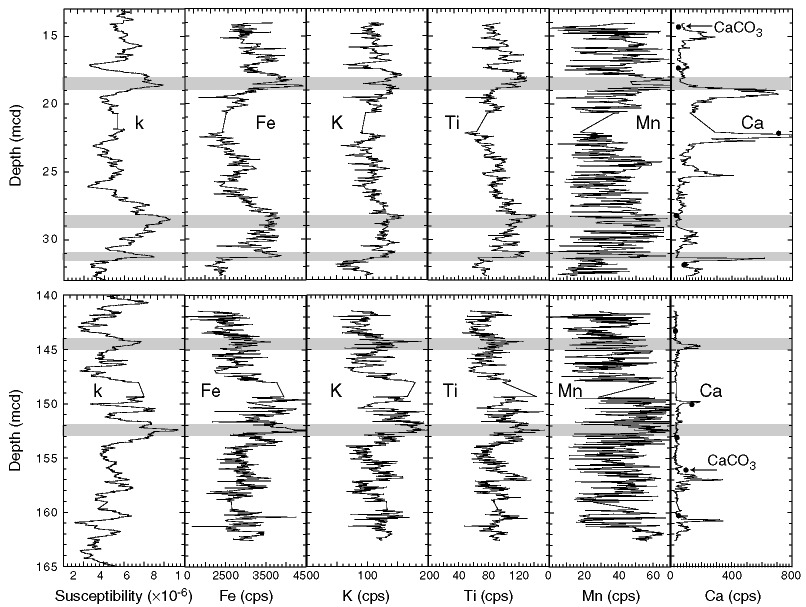
Figure F7. XRF core-scanner data of the upper (top panel) and lower (bottom panel) intervals. Magnetic susceptibility data (far left panel) are shown for comparison. Horizontal shaded boxes highlight high values of shipboard susceptibility values (far left panel) for comparison.

![]()