![]() Figures F1-F4
Figures F1-F4
![]() Tables
T1-T2
Tables
T1-T2
F1. Location map of ODP Leg 175 sites.
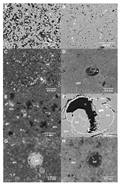
F2. Photomicrographs of dolomite horizons.
F3. CL spectrum showing Mn-activated luminescence.
F4. X-ray diffractograms of semilithified and lithified horizons.
T1. Stratigraphic, compositional, luminescent, and isotopic data for dolomite samples.
T2. Electron microprobe analyses of iron concentrations in dolomite.