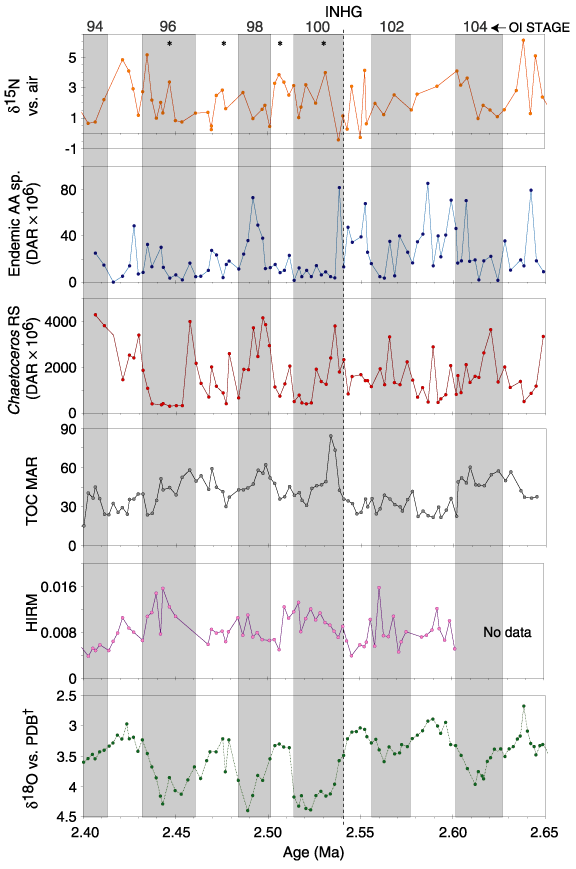
Figure F2.
Downcore reconstructions vs. age for  18O vs. PDB (providing age model) after Vidal et al.,
(submitted, this volume [N2]); total organic carbon (TOC) (mass accumulation rate [MAR] is in grams per centimeter per thousand years); Chaetoceros resting spores (RS) (diatom accumulation rate [DAR] is in valves per square centimeters per thousand years); Southern Ocean diatoms (diatom accumulation rate); an
  15N vs. air, where asterisks illustrate times of possible denitrification. "Hard" isothermal remanent magnetism curve (HIRM) shown for comparison. White/gray bands show interglacials/glacials, respectively.
t
= after Vidal et al. (submitted, this volume [N2]).

![]()