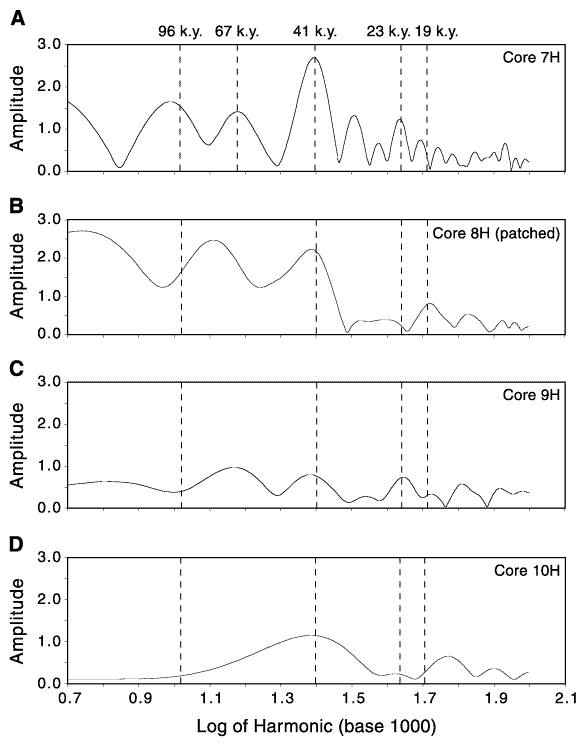
Figure F5.
Fourier spectrum of the ![]() 18O
stratigraphy of the cores studied, using the sedimentation rate based on tuning
to the 41-k.y. cycle. A. Core 175-1085A-7H. Note the dominant
peak at 41 k.y. and the cycles near 100 and 23 k.y. Also note the 67-k.y. cycle,
resulting from the beating of the 100-k.y. cycle with the 41-k.y. cycle: (100 x
41)/(100 - 41). B. Core 175-1085A-8H. C.
Core 175-1085A-9H. D. Core 175-1085A-10H.
18O
stratigraphy of the cores studied, using the sedimentation rate based on tuning
to the 41-k.y. cycle. A. Core 175-1085A-7H. Note the dominant
peak at 41 k.y. and the cycles near 100 and 23 k.y. Also note the 67-k.y. cycle,
resulting from the beating of the 100-k.y. cycle with the 41-k.y. cycle: (100 x
41)/(100 - 41). B. Core 175-1085A-8H. C.
Core 175-1085A-9H. D. Core 175-1085A-10H.

![]()