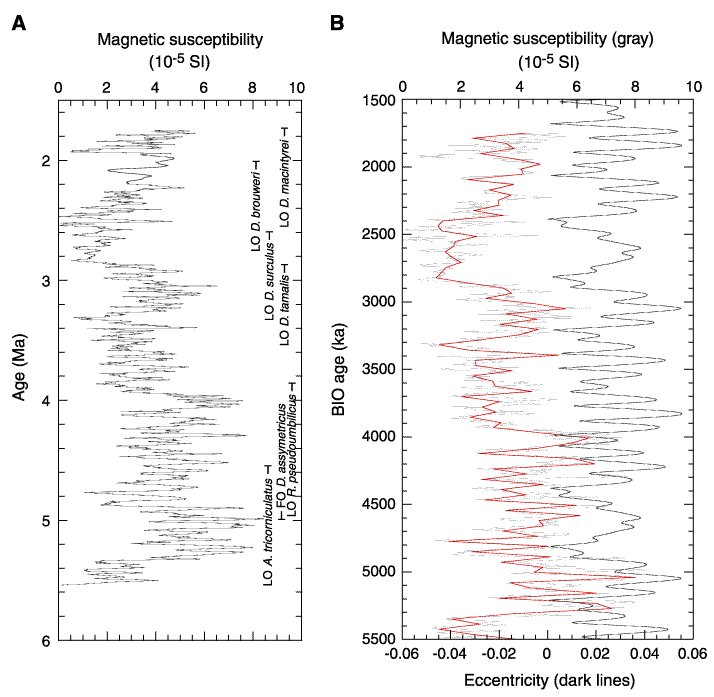
Figure F3. A. The biostratigraphic (BIO) age model. A nine-point moving window was applied once to the composite magnetic susceptibility data. Calcareous nannofossil datums used to determine the age model are shown. LO = last occurrence, FO = first occurrence. B. Comparison of BIO age model and the eccentricity record. A cubic spline smoothing function (heavy black line) was applied to the MS data (plotted in gray). Approximately 100- and 400-k.y. cycles exist in the record but do not correlate well with the eccentricity curve without tuning.

![]()