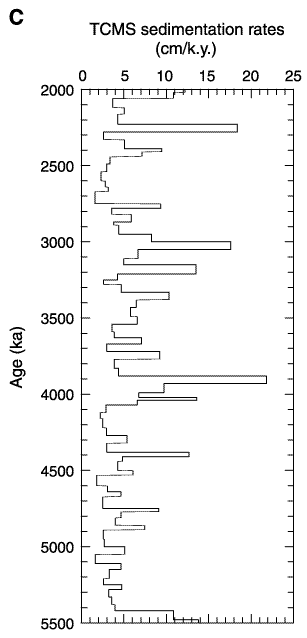
Figure F4. A. Age-depth plot using the biostratigraphic (BIO) age model only. Note the reduced sedimentation rate at ~100 m (~2.5 Ma). B. Age-depth plot using the tuned core magnetic susceptibility (TCMS) age model only. Note the increased variability in sedimentation rate. C. Sedimentation rates derived from the TCMS age model.


![]()