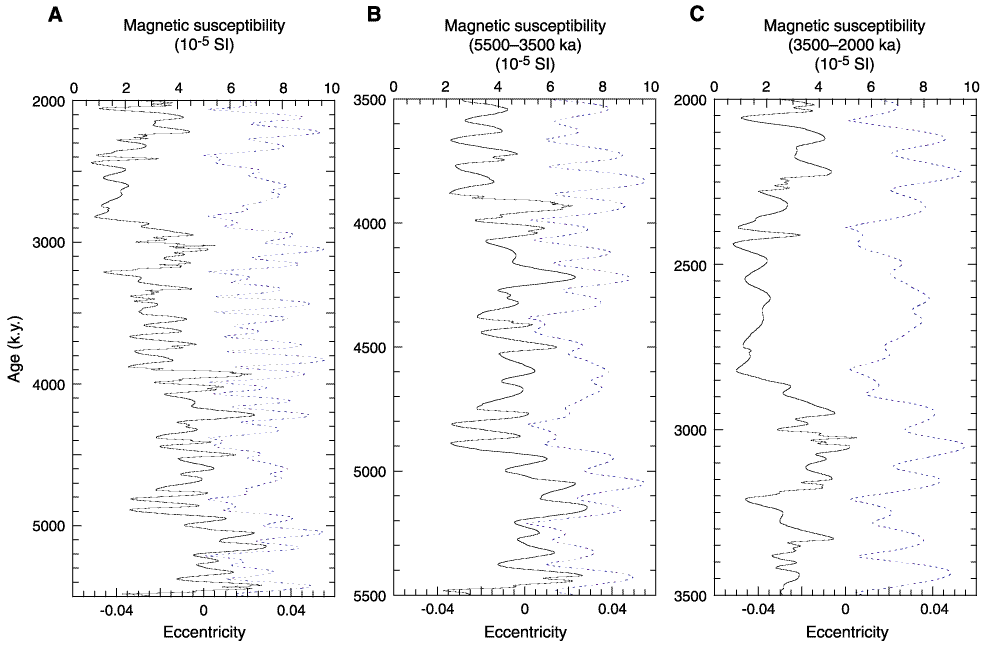
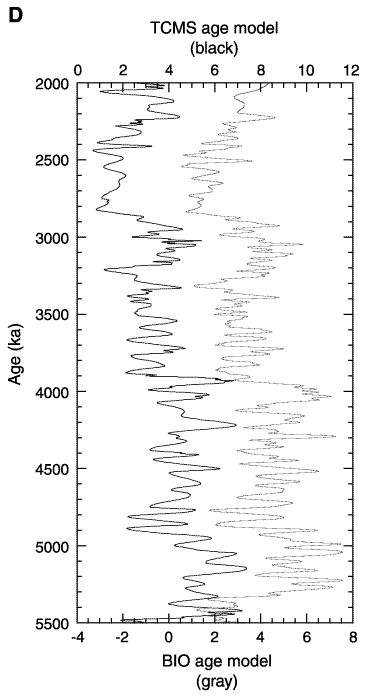
Figure F6. A. The tuned core magnetic susceptibility (TCMS) age model with a nine-point moving window applied and compared to the eccentricity curve (dashed lines) in this same interval. B, C. The TCMS record (dashed) is magnified over two intervals ([A] 5500-3500 ka and [B] 3500-2000 ka) to show detail and to compare to the eccentricity curve (solid). D. The TCMS model (solid) is compared to the BIO age model record (dashed). The major difference between the models occurs between 5000 and 4000 ka, whereby the BIO model (solid) is younger than the TCMS model (dashed). The data were tuned nine times with a nine-point filter to remove the subeccentricity variability and enhance the correlation to the eccentricity curve.


![]()