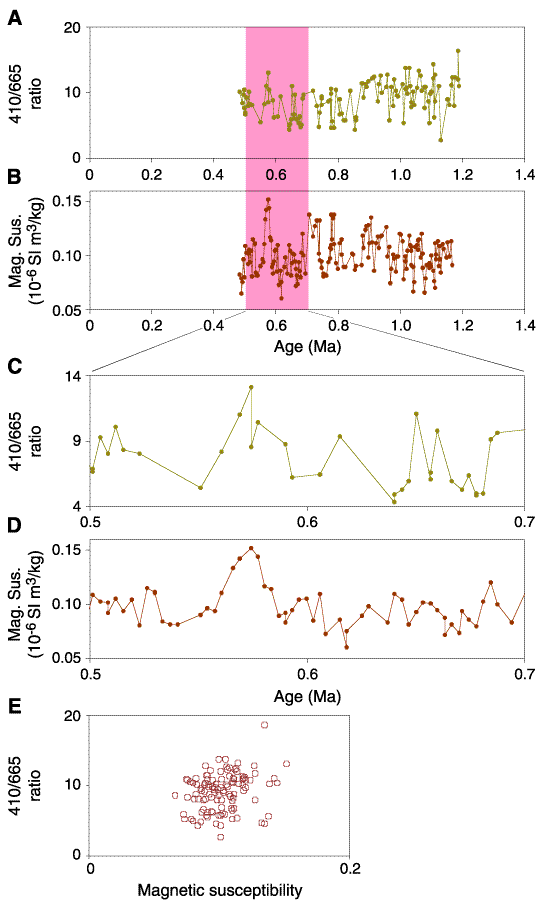
Figure F9. Records from Hole 1077A of (A) the 410/665 ratio and (B) magnetic susceptibility vs. age and (C) the 410/665 and (D) magnetic susceptibility records over the 0.5- to 0.7-Ma interval (shaded on A and B), plus (E) a scatter plot of the 410/665 ratio against magnetic susceptibility (10-6 SI m3/kg).

![]()