Frontispiece 1: 
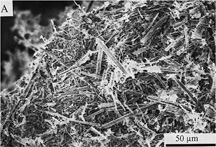
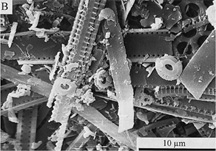
The two pictures on the left side are scanning electron microscope photographs of dry piece of sediment from T. antarctica-rich interval (Sample 175-1084A- 47X-2W, 70-73 cm). (A) General aspect, (B) Close-up view. Note the fragments of Thalassiothrix and the presence 
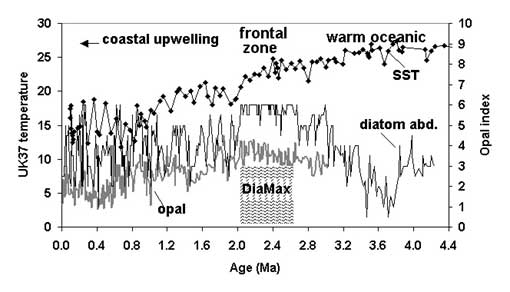
of coccoliths. The graph on the right side illustrates the sea surface temperature (SST) record derived from UK37' index (alkenones), diatom abundance ,and opal index from Site 1084. Note the diatom maximum (DiaMax) in the frontal zone and the decrease in abundance towards the warm oceanic region.


Frontispiece 2: The high resolution graph on the left shows Fe (red line) and Ca (blue line) intensities (counts per second) from ODP Site 1085.The Late Miocene/Early Pliocene records of iron (Fe) and calcium (Ca) intensities were measured (every 4 cm) by a non-destructive X-ray fluorescence (XRF) core scanner, available at the Bremen ODP core repository. The astronomically calibrated ages were obtained from the high resolution benthic d18O record at Site 1085.


The figure on the right shows the seismic line GeoB/AWI 93-015 at sites 1078 and 1079. Vertical axis is given in two-way travelline. Common depth point (CDP) interval is 25 m for a shotpoint spacing 0f 25 m. Seismic data is 24-fold stacked and not migrated. Site 1078 is located at CDP 8550; Site 1079 at CDP 8150. Four additional sites (MAB 3, 4, 5A, 5B) were originally proposed; one (MAB 5B) was withdrawn before the safety review