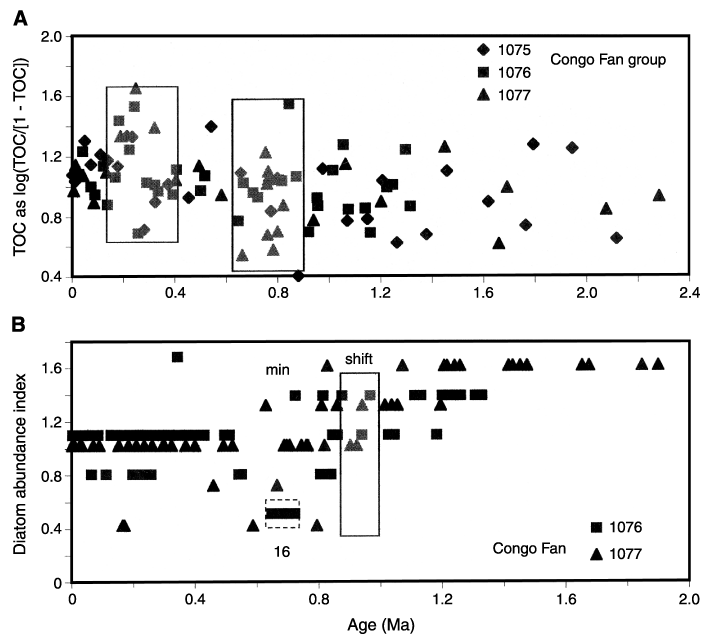
Figure F17. Patterns of organic carbon and of diatom abundance at the Congo group sites, based on shipboard results (data from Wefer, Berger, Richter, et al., 1998). A. TOC is plotted as the log of TOC/(1 - TOC), standardized. B. Visual diatom abundance index, standardized. 16 = isotope stage (glacial).

![]()