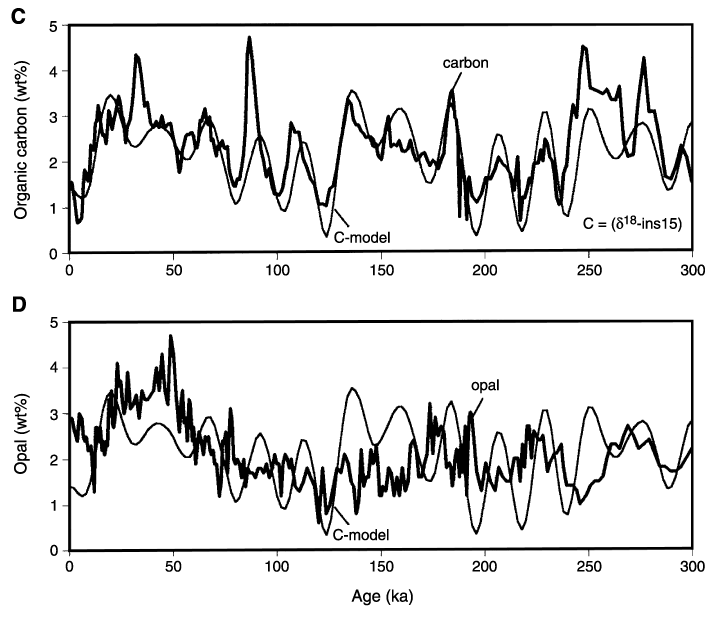
Figure F18 (continued).
C. Modeling the organic carbon abundance, using a global  18O curve (OJsox96) (Berger et al., 1996) and the insolation at 15°N in July (Berger and Loutre, 1991) (weights adjusted for best fit).
D. Demonstration that the model for organic carbon deposition does not work for opal. Data for TOC, opal, and timescale are from Schneider et al. (1997).

![]()