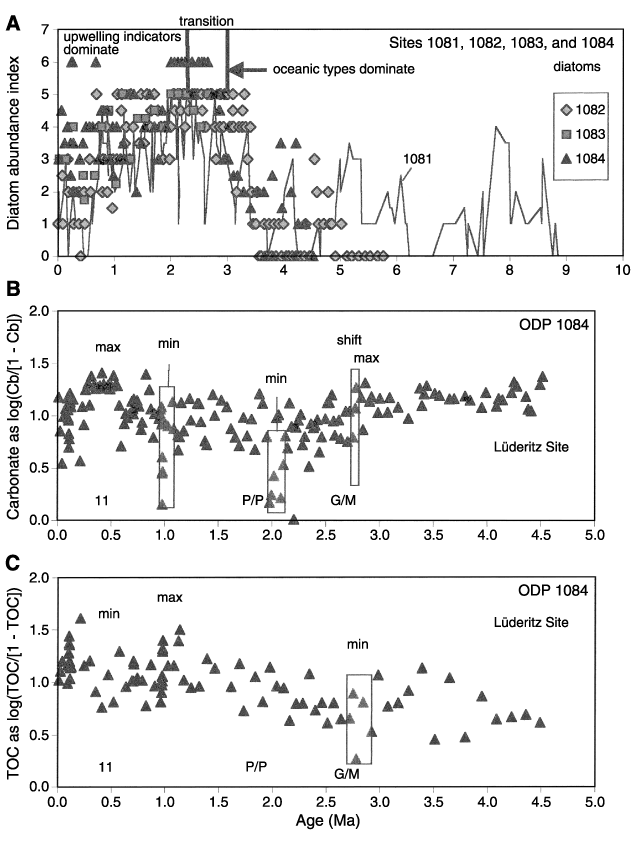
Figure F29. Comparison of diatom abundance, carbonate, and total organic carbon (TOC) content at Site 1084. A. Diatom smear slide abundance (Shipboard Scientific Party, 1998g, 1998h, 1998i, 1998j) for Walvis group sites (1081, 1082, and 1083) and Lüderitz Site (1084), showing the early Matuyama Diatom Maximum, centered on 2.2 to 2.3 Ma. The diatom regimes (oceanic types dominate, transition, and upwelling indictors dominate) are based on diatom taxonomy as interpreted in Lange et al. (1999). B. Shipboard carbonate data. C. Shipboard organic carbon data. Ages were reassigned based on age models in this report. Max = maximum, min = minimum, P/P = Pliocene/Pleistocene boundary, G/M = Gauss/Matuyama boundary, 11 = Stage 11.

![]()