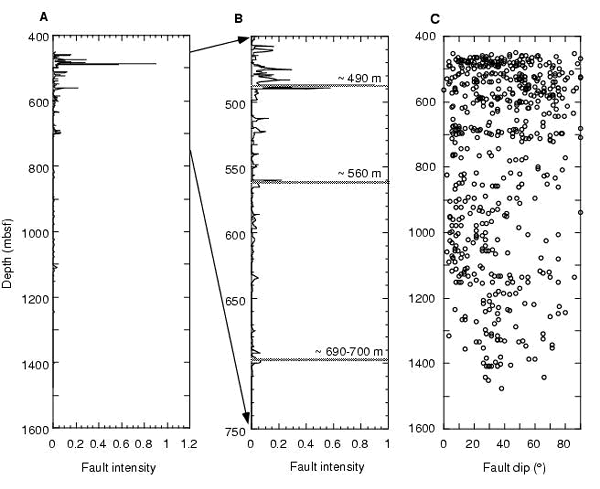
Figure F93. A. Downhole variability of the average intensity of cataclasis from visual core descriptions. Section includes relogged core from 118-735B-82R-6 through 88N (depths from 450 to 500 mbsf). B. Enlarged section showing downhole variability of the average intensity of cataclasis from visual core descriptions, highlighting the major fault zones (490, 560, and 690-700 mbsf). C. Downhole variability of fault dip from visual core descriptions. Note that zones of intense cataclasis show a wide range in dip angle.
