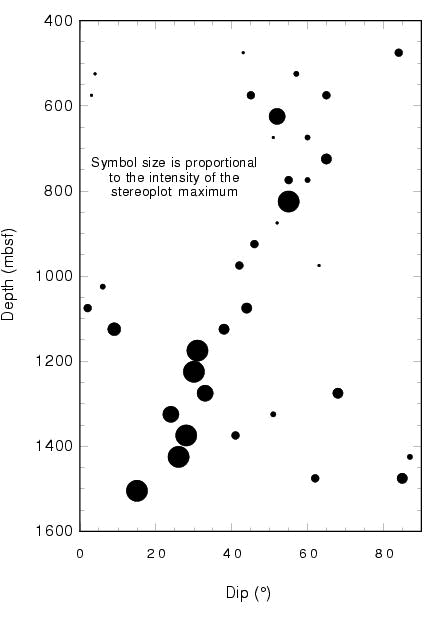
Figure F99. Variation in vein dip with depth. Data shown in Figure F94 between 450 and 1508 mbsf have been grouped into 50-m intervals, plotted using a stereonet program, and contoured. The intensity of any contour maximum for each interval has been used to determine the size of each symbol: large symbols indicate a high intensity of points around that dip value; smaller symbols indicate a wider spread of dip values. Several contoured maxima may be present in any one interval.
