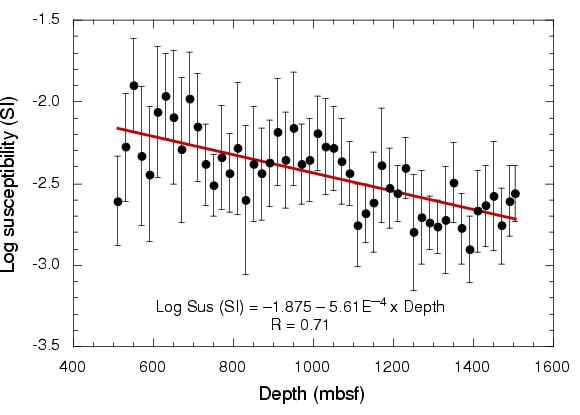
Figure F108.
Variation in average magnetic susceptibility with depth in Leg
176 Hole 735B. Points represent values of geometric means (±1 ![]() error bars)
for 20-m intervals, calculated from the filtered susceptibility
data. One
error bars)
for 20-m intervals, calculated from the filtered susceptibility
data. One ![]() error on slope is 1.26 × 10⁻⁴.
error on slope is 1.26 × 10⁻⁴.
