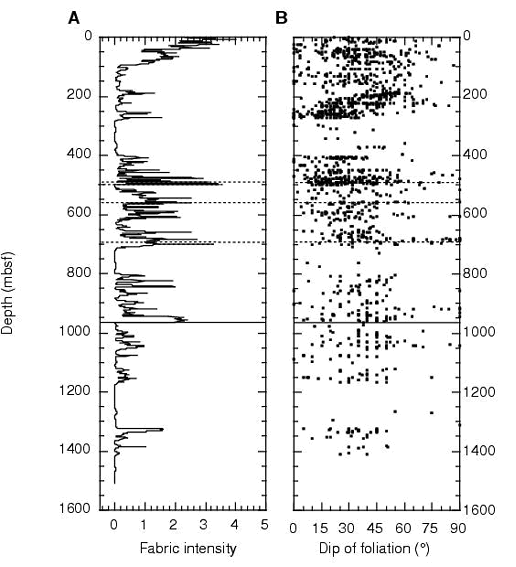
Figure F82. Variation in crystal-plastic deformation intensity and orientation of crystal-plastic foliation with depth. A. Plot of average deformation intensity vs. depth including data from Leg 118 (Dick et al., 1991a). The locations of major faults (dashed lines) and a major shear zone (solid line) are also shown. B. Plot of the dip of the crystal-plastic foliation in the core reference frame vs. depth, including data from Leg 118 (Dick et al., 1991a).
