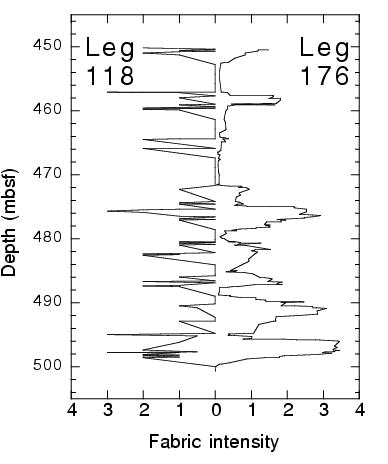
Figure F83. Comparison of crystal-plastic deformation intensity logged for the interval between 450 and 500 mbsf in Hole 735B during Legs 118 and 176 (see text). The deformation intensity for Leg 176 is an 11-cell running average of the crystal-plastic deformation log (see PLASTIC.XLS spreadsheet in "Appendix" in the "Leg 176 Summary" chapter), whereas the intensity from Leg 118 represent "visual averages" of ~1- to 2-m intervals.
