![]()
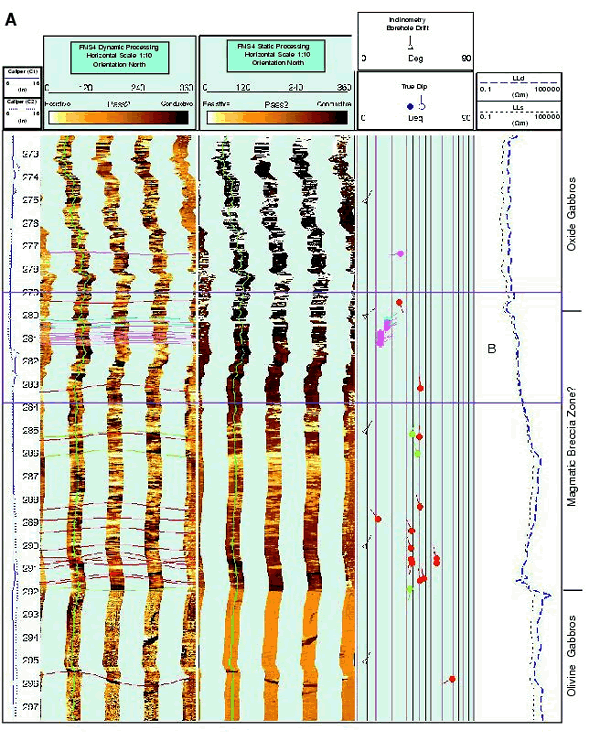
Figure F133. A. FMS image showing a 25-m interval that includes the transition from the oxide gabbros of Unit IV, through the breccia zone and into the olivine gabbros of Unit V. This figure also includes a depth scale in mbsf; caliper data from the FMS; dynamic and static processed FMS images; borehole drift and structural dips and azimuth; and deep and shallow resistivity logs from the DLL. (Continued on next page.)
![]()