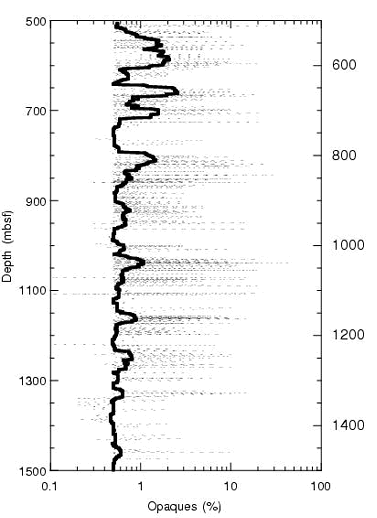
Figure F22. Plot of oxide abundance vs. depth in the Hole 735B cores. The light dashed lines show opaque abundances averaged over 1-cm segments of the core; the darker solid line indicates the average amount of opaques per meter in the core calculated as a running average of the 1-cm data. In most of the coarse-grained gabbros, the amount of opaque material could not be accurately determined at abundances of 0.5% or less, and a nominal value of 0.5% was reported for these samples. As a result, the apparent lower boundary for average oxide abundance at ~0.5% is artificial.
