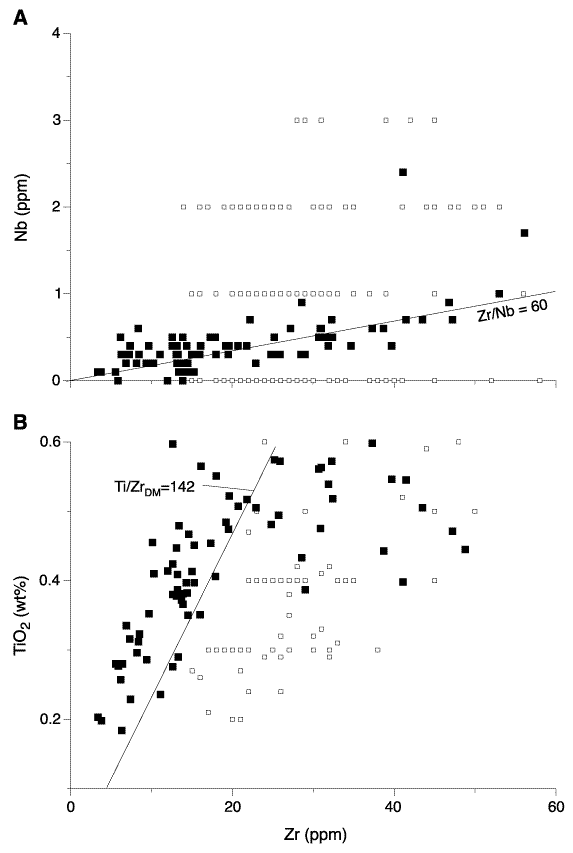
Figure F1. A.
Nb vs. Zr for samples with Zr < 60 ppm, mainly olivine gabbros. Solid squares
= data from this work, open squares = shipboard analyses. Zr and Nb correlate
rather well in the new data set, perhaps indicating analytical problems with the
shipboard data. B. TiO2 vs. Zr for the same data.
Shipboard Zr analyses may be considered 10-20 ppm too high at low Zr
concentrations. (Ti/Zr = 142 for depleted mantle is from McKenzie and O'Nions,
1991).


![]()