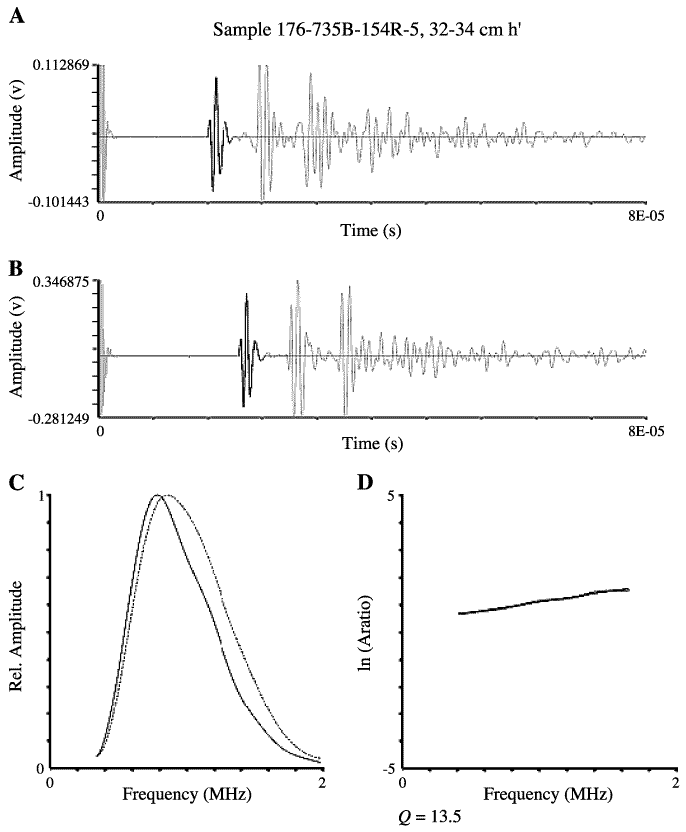
Figure AF2. A. Diagram showing data acquired during Q experiments. The recorded waveform with the gray line being the entire waveform and the black line being the windowed version that was used for the analysis. B. A similar graph displaying the reference waveform (and its windowed version) from a 2-in-long aluminum sample. C. The amplitude spectra of the waveforms for the aluminum (dashed) and sample (solid) are plotted. D. A plot of the portion of the amplitude ratio (Aratio) vs. frequency that was used for computing Q, and a line indicating the inferred slope.


![]()