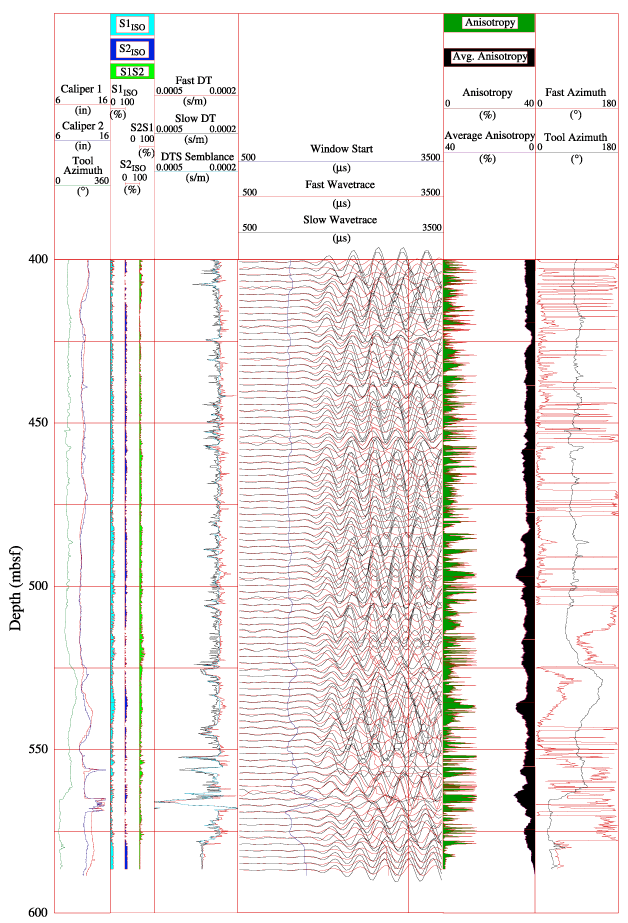
Figure AF3. Processed cross-dipole shear wave data collected during Leg 176 for the upper 600 m of Hole 735B. The plot shows the caliper and tool azimuth measurements, quality curves (S1ISO and S2ISO) that were used for the anisotropy estimate (S1ISO/S2ISO) and anisotropy azimuth (S1S2), fast and slow direction transit time curves (0.152-m sampling interval), semblance, fast (red) and slow (black) shear waveforms, anisotropy and average anisotropy (2.5-m sliding window) curves, and fast-wave orientation and tool azimuths. DT = delta time, DTS = shear slowness.