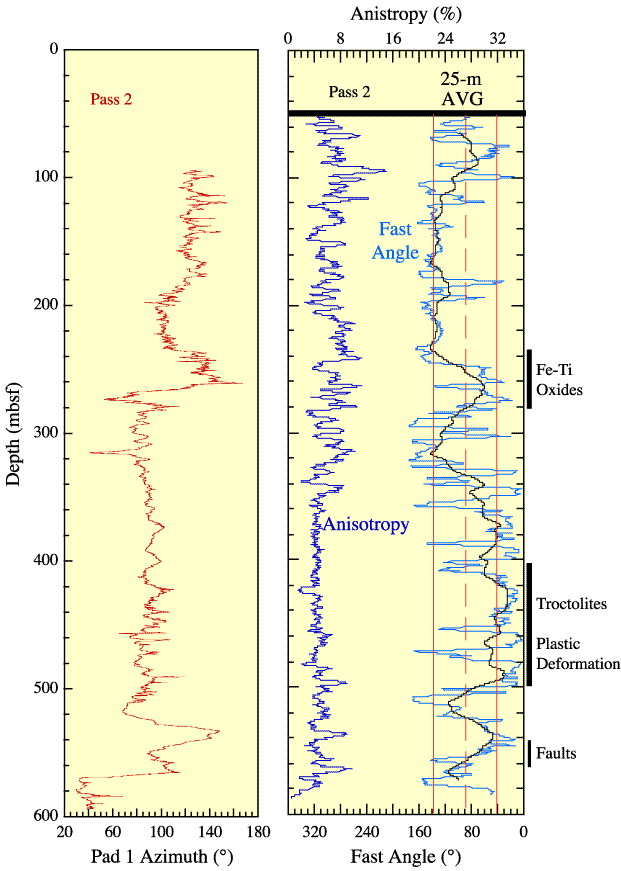
Figure F10. Downhole logs showing the FMS pad 1 azimuth as well as the fast angle azimuth and the average anisotropy determined from DSI analyses. The fast azimuth curve was smoothed using 20 point (blue) and 25-m sliding windows (black). The dashed vertical line (red) represents the average value of 89° for the entire logged section. The solid vertical lines (red) represent the maximum and minimum standard deviation values of 138° and 40° calculated from the smoothed fast azimuth curve (blue).


![]()