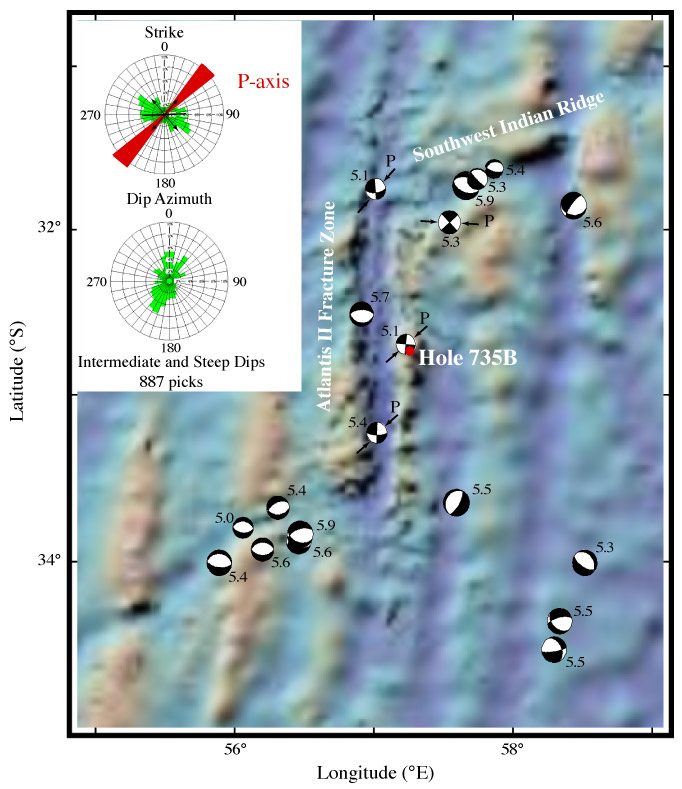
Figure F11. Bathymetric map showing the Atlantis II Fracture Zone and surrounding area. The map was created using the Lamont-Doherty Earth Observatory multibeam bathymetry database. Focal mechanisms and earthquake magnitudes (Mw) are plotted based on the Harvard Centroid Moment Tensor (CMT) solutions (Cornell University GIS Group, 1998). Strike and dip azimuth rose diagrams are based on FMS interpretations of intermediate (30°-60°) and steep (60°-90°) dips of foliations and fractures in Hole 735B. Black arrows in the insert represent the maximum and minimum orientations of the shear wave fast directions based on DSI analyses. The black line represents the average fast-angle orientation of the entire logged interval. The red P-axis line shows the approximate orientation of the compressional axis of the three strike-slip events along the Atlantis II Fracture Zone. The location of Hole 735B is marked is also shown (red dot).