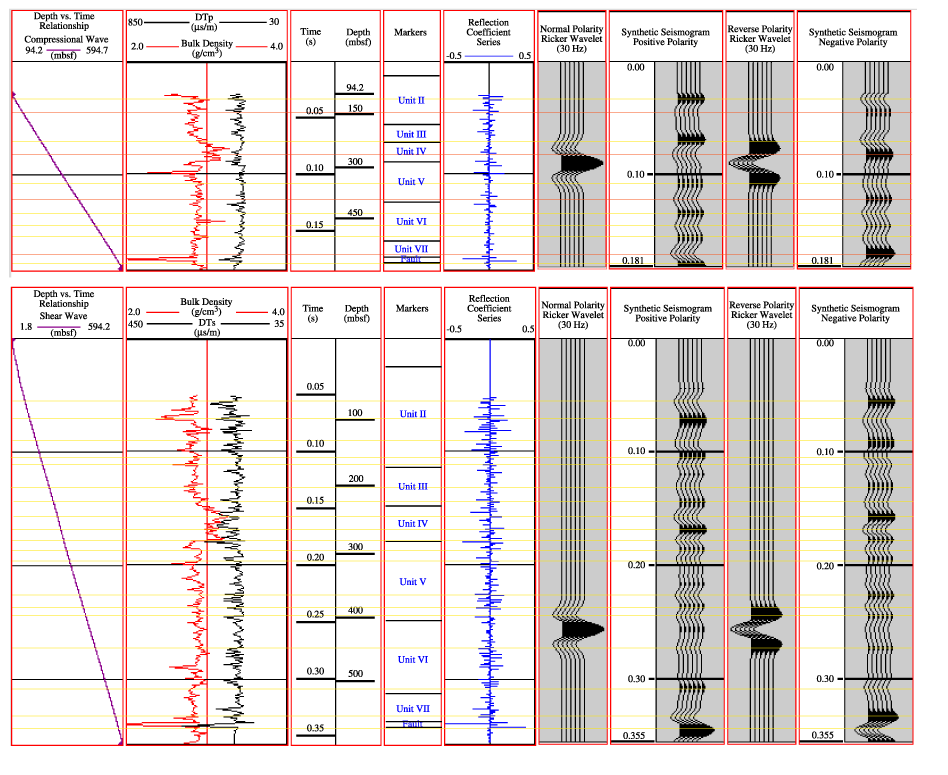
Figure F12. Compressional wave and shear wave synthetic seismograms from logging data collected during Leg 176. The plots show a depth-time relationship, transit time and density curves from the logs, depth and time scales, prominent boundaries, a reflection coefficient series, normal and reverse polarity synthetic traces, and a standard trace consisting of a 30-Hz Ricker wavelet. Yellow horizontal lines show the correlation between reflections and the downhole logs. Red horizontal lines represent the correlation of reflections between the synthetic seismogram using a 30-Hz Ricker wavelet and the results from using lower frequency 10-Hz Ricker and Ormsby (low cut = 2 Hz, low pass = 5 Hz, high pass = 15 Hz, and high cut = 20 Hz) wavelets.


![]()