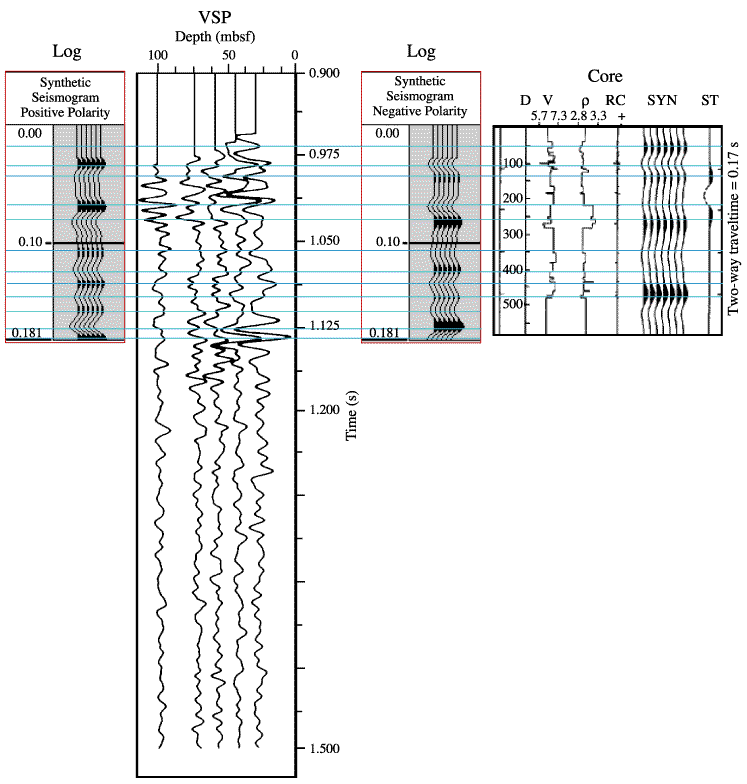
Figure F14. Correlation between Leg 176 synthetic seismograms produced with logging data collected during Leg 176 and VSP results from the experiment carried out during Leg 118 (Robinson, Von Herzen, et al., 1989; Swift et al., 1991). A synthetic seismogram produced with core data for the upper 500 m is also included in the comparison (Iturrino and Christensen, 1991). D = depth (mbsf), V = velocity model (km/s),  = density model (g/cm3), RC = reflection coefficient series, SYN = synthetic seismogram consisting of seven identical traces, ST = standard trace representing a +0.1/-0.1 reflection coefficient interface that is provided for comparing amplitudes.


 = density model (g/cm3), RC = reflection coefficient series, SYN = synthetic seismogram consisting of seven identical traces, ST = standard trace representing a +0.1/-0.1 reflection coefficient interface that is provided for comparing amplitudes.

![]()