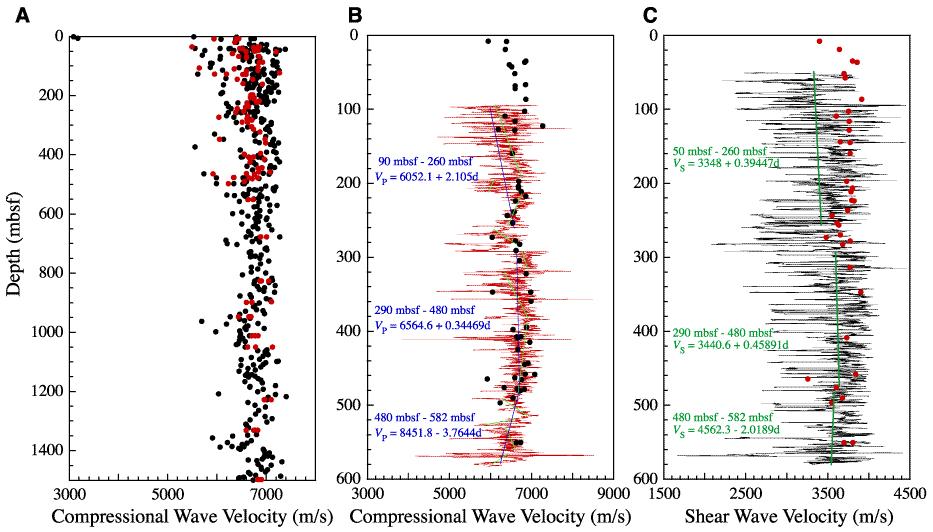
Figure F5. A. Discrete laboratory compressional wave velocity (VP) measurements are shown as a function of depth. Atmospheric pressure measurements (black) and in situ measurements (red) are shown. B. Comparison between in situ VP measurements and log measurements for the upper 600 m. Blue lines represent a linear fit to the log data for the large intervals shown. Green lines represent velocity trends for smaller intervals based on log data (VP = compressional wave velocity and d = depth). C. Comparison between discrete in situ laboratory shear wave velocity (VS) measurements (red) and log data is shown. Average values for the laboratory VS data were used. Velocity gradients based on log data are also shown for three intervals (VS = shear wave velocity and d = depth). Equations defining the VP and VS gradients for the entire section are given in the text but are not shown here for clarity of presentation.


![]()