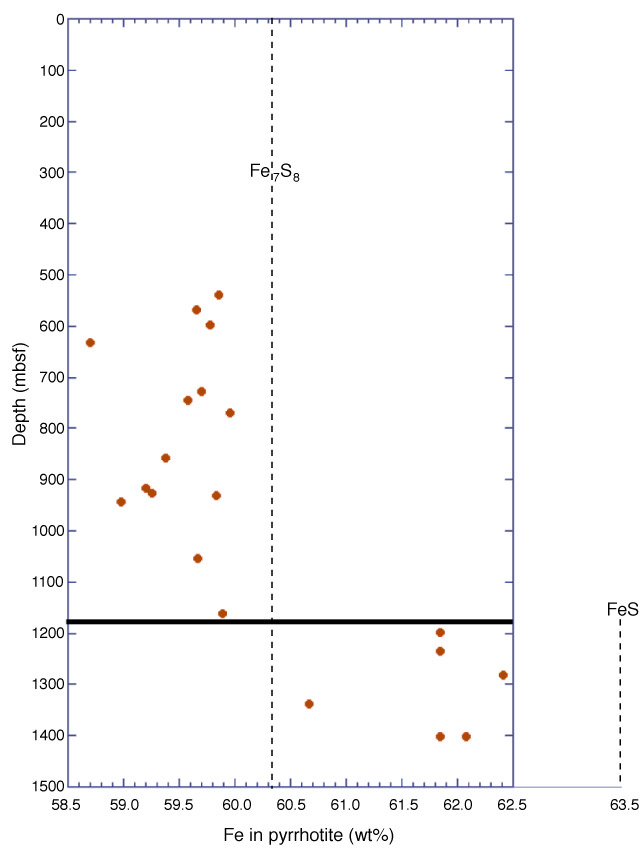
Figure F6. Fe in pyrrhotite shows a radical change in composition between 1165 and 1200 mbsf from Fe-poor to Fe-rich varieties (stoichiometric pyrrhotite to nearly troilite). The dark horizontal line marks the depth of this abrupt mineralogical and geochemical boundary.