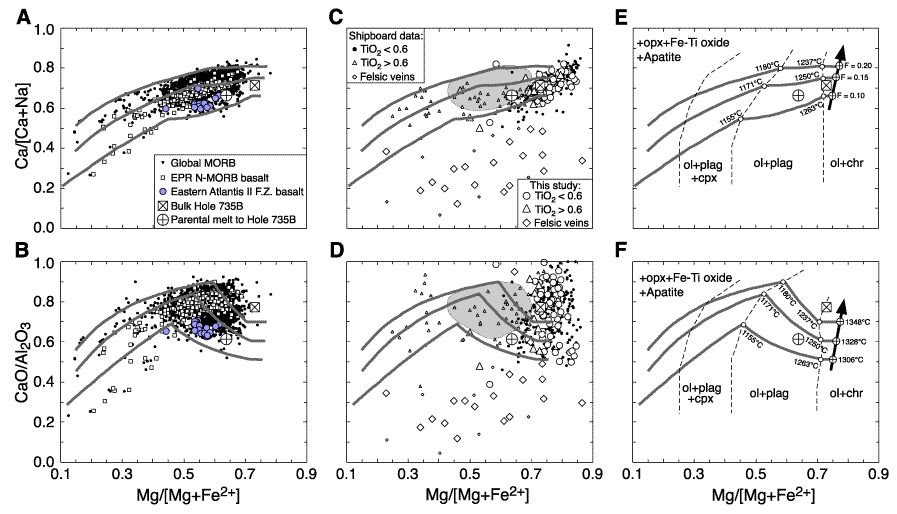
Figure F3. Plots of Ca# and CaO/Al2O3 vs. Mg# to compare Hole 735B gabbroic rocks with mid-ocean-ridge basalt (MORB) samples and model melt compositions. A, B. Global MORB data are Niu and Batiza (1993) compilation. C, D. The shaded areas are MORB fields defined by >90% of global MORB data in A and B. E, F. The solid arrows are compositions of model melts produced by decompression melting initiated at 25 kbar. The small circles with pluses are three such melts extracted, respectively, at different depths corresponding to 10%, 15%, and 20% melting (Niu and Batiza, 1991; Niu, 1997). The thick shaded curves are liquid lines of descent (Weaver and Langmuir, 1990) from these three model melts at 1-kbar pressure. Note that Atlantis II Fracture Zone (AII F.Z.) basalts plot at the low-Ca# and low-CaO/Al2O3 end of the global MORB data array, which is consistent with the interpretation that these melts result from the lowest extent of melting at the slowest spreading ridge (Bown and White, 1994; Muller et al., 1997; Niu and Hékinian, 1997). Note that a number of samples with CaO/Al2O3 > 1 are not shown in D. Note the differences between bulk Hole 735B average (large square with cross) and primitive melt (large circle with plus) parental to the most primitive olivine found in Hole 735B. References for East Pacific Rise (EPR) and AII F.Z. MORB are given in Figure F2. opx = orthopyroxene, ol = olivine, plag = plagioclase, cpx = clinopyroxene, chr = chromite.

![]()