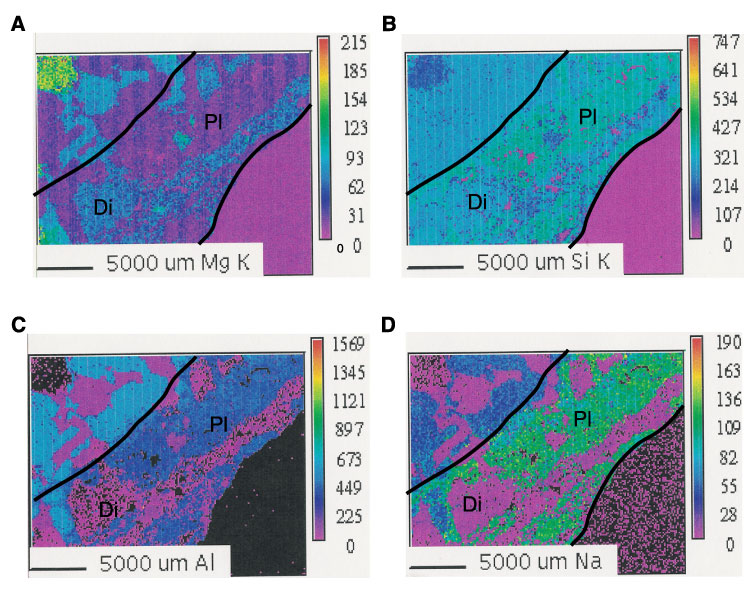
Figure F9.
Chemical map showing relative abundances of (A) Mg, (B)
Si, (C) Al, and (D) Na in a plagioclase +
diopside vein (Sample 176-735B-123R-6, 140-144 cm). The vein boundary in the
upper left (delineated by solid black line) is marked by distinct changes in Al,
Si, and Na, reflecting changes in plagioclase composition. The boundary in the
lower right is against epoxy. Most of the vein is filled with sodic plagioclase
(Pl), but the distinct band along the center is filled with diopside (Di) in a
matrix of black to dark brown aphanitic material. Scale bars = 5 mm.