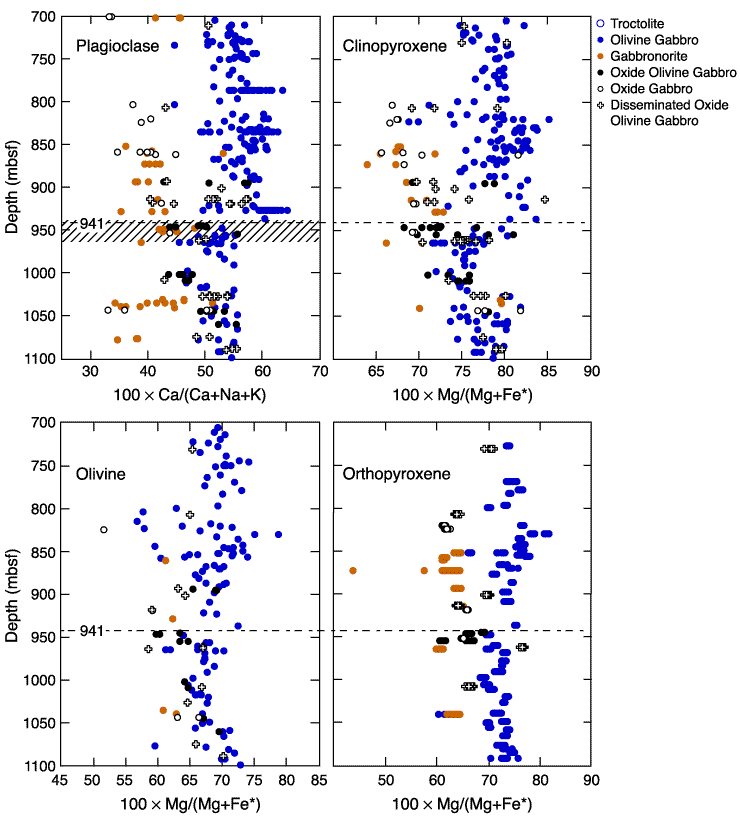
Figure F14. Expanded plots of the downhole mineral variations around the 941-mbsf chemical discontinuity. The shaded region in the plagioclase plot shows the location of the 30-m zone of crystal-plastic deformation from 930 to 960 mbsf. It is noteworthy in this context that <10% of the Hole 735B core shows such intense deformation.


![]()