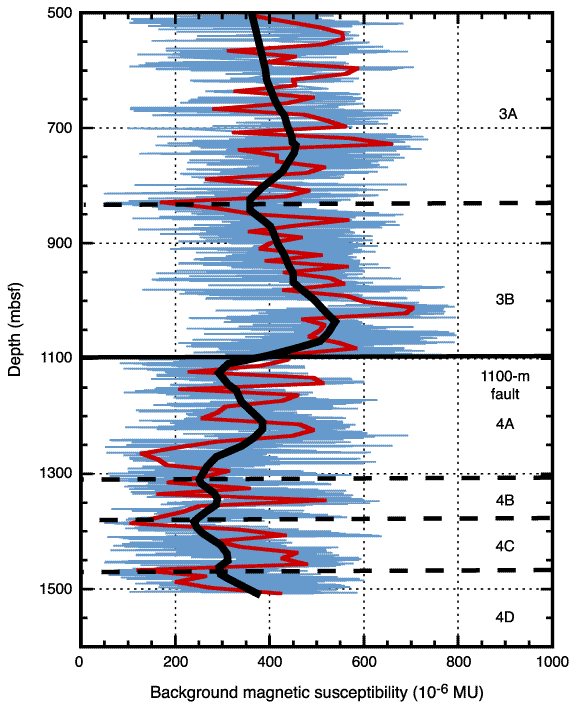
Figure F10. Background magnetic susceptibility vs. depth from 500 to 1500 mbsf. The two curves are (1) smoothed over 10% of the data (smoother) and (2) interpolated (more peaks). The break in background magnetic susceptibility at 1000 mbsf is given by the bold black line, indicated as the 1100-m fault. The dashed lines correspond to minima in the smoothed curve and appear to divide the core into major blocks (3 and 4) of olivine gabbro and troctolite, with internal fluctuations in magnetic susceptibility (A, B, etc.). There are two other blocks of olivine gabbro in the upper 500 m of the hole.