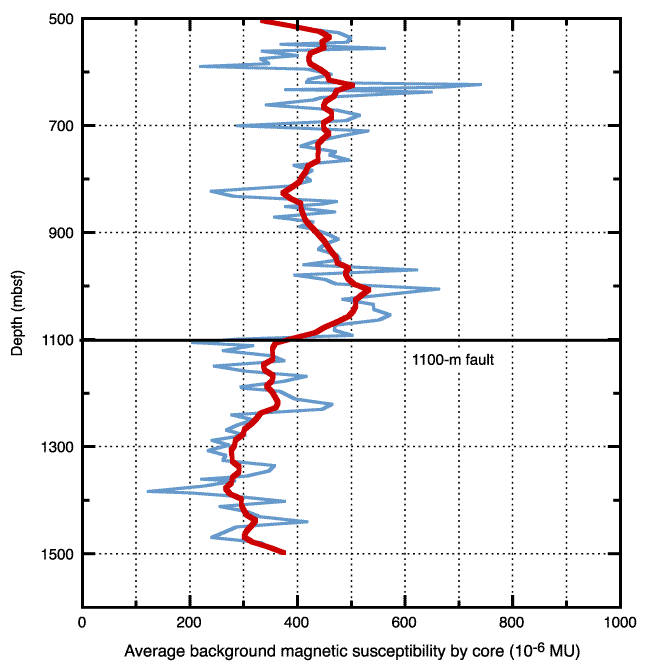
Figure F11. Average background magnetic susceptibility by core vs. depth from 500 to 1500 mbsf. This weights the data by cored interval rather than by recovery. The drop in magnetic susceptibility at 1100 mbsf is indicated by the black line, identified as the 1100-m fault. The thick curve is smoothed over 10% of the number of cores and resembles the smoother curve in Figure F12. Magnetic susceptibility (x 10-6 SI) for all of Hole 735B, merging the downhole log from 20 to 490 mbsf (Leg 118) and the measurements obtained during Leg 176 using the MST and corrected to SI units using the factor 0.66, as discussed in the text (504-1508 mbsf). The three highest minicore measurements for each leg are also plotted. Susceptibility units as defined in the text are indicated to the right.


![]()