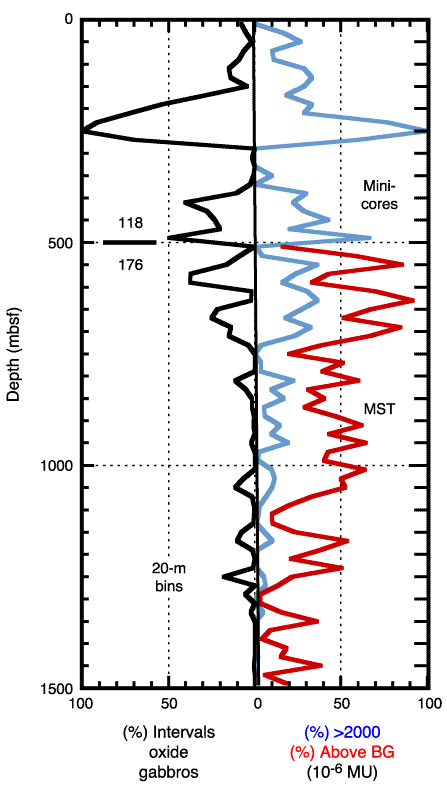
Figure F13. Right: percent of measurements with magnetic susceptibility >2000 x 10-6 MU (curve with lower values) and of the percent of measurements above background (curve with higher values) from 500 to 1500 mbsf in 20-m intervals, and of the percent of minicore measurements with magnetic susceptibility >2000 x 10-6 MU from 0 to 500 mbsf (continuation of blue curve). Left: percent of core described as oxide gabbro, oxide gabbronorite, and oxide olivine gabbro, given as lithologic intervals from 0 to 1500 mbsf, also in 20-m intervals. Note the similarity between the curve with lower values on the left and the curve on the right. BG = background.


![]()